Interesting Tech Projects
So You Want to be a Cartographer?
Love maps? Want to make your own? Now it’s easy thanks to a set of free software.
Previously I wrote about the OpenStreetMap project, which allows anyone to edit a map of the world. People can add points, lines and areas and “tag” them to show what they are. Once the data is uploaded a new version of the map is generated for everyone to see.
For example I could create a point on the map and tag it with “railway=station” to indicate that it is a train station. I could draw a line and tag it with “highway=residential” to mark the line as a residential road. I could also draw an enclosed area and tag it with “landuse=forest” to show that the area is a forest. There are many different tags that can be used to represent all kinds of things that appear on maps.
This article is in the form of a tutorial to get you quickly started creating your own maps. I will introduce the software involved and show how to use it step by step. The result of the tutorial is a map of the North Yorkshire Moors Railway, which is a steam train service on a historic train line in England and is featured in the Harry Potter films.
Get the Data
To quickly get started we will use some map data from the OpenStreetMap project. This data has a license which you must follow, however you can create your own map data from scratch, either by using a GPS/hiking SatNav unit to perform surveys or even create maps of imaginary places or recreate historical maps.
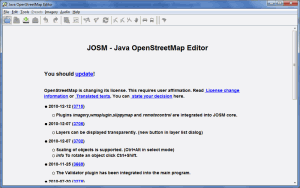
The first piece of software is the map editor, called JOSM. This is downloaded to your PC and you can run it by double-clicking on the file. You must have Java installed on your PC if you don’t already.
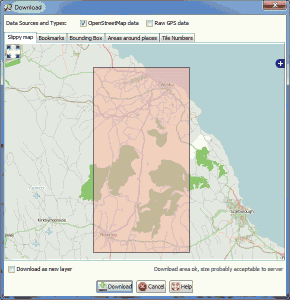
To download data in JOSM go to the File menu and choose Download from OSM… a window showing a map will appear. You can scroll around by dragging and zoom in and out using the mouse wheel.
Find the town of Pickering in the north of England and drag a box from Pickering to Whitby, being sure to include both towns as shown in the image. Then click on Download.
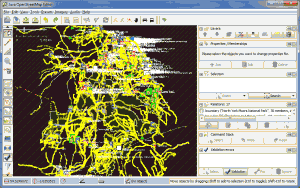
Once the data has downloaded it will show in JOSM as lots of multicoloured ponts, lines and areas.
At this point you could edit the map by clicking on items and then changing the tags, however that is outside the scope of this tutorial. For more information see the JOSM documentation. For now simply save the data without changing it by going to the File menu and choosing Save As… Save the file as nymr.osm in an empty folder.
Render the Map
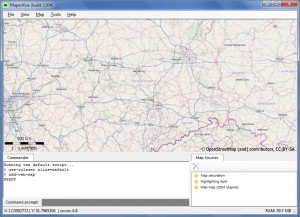
The software we will use to render the map is called Maperitive. Download the latest version (the one with the largest number), install it on your PC then start the application.
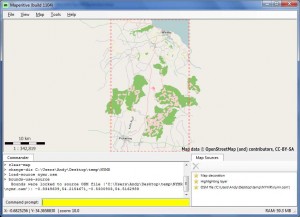
The map shown is not from our data so the first thing we need to do is get rid of it. Click in the Command Prompt box at the bottom so it turns yellow. The command is “clear-map” however you can’t simply type it in as Maperitive tries to guess the command you want. This means that after every key press you need to stop typing and look at the yellow box to see what has happened. In practice for this command you will need to type “cl” followed by “m”. Press Enter and the map will dissappear.
Next we need to switch to the folder where you saved your copy of nymr.osm. Here is an example:
change-dir C:\Users\Andy\Desktop\temp\NYMR
Next load the data and set the edge of the map to match the data:
load-source nymr.osm
bounds-use-source
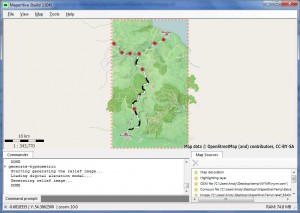
Show is a rendering of your map along with a dotted line around the edge to show the boundary. When you save the map later nothing outside of the dotted line will be included.
The map works in the same was as JOSM. You can scroll around by clicking and dragging and zoom in and out using the mouse wheel. To reset the view to show the entire map go to the View menu and choose Zoom All.
One thing you will immediately notice is the large pink dashes on the map. They remind me of pictures of bacteria under a microscope but in our case they are trails that have been marked as private. The first thing we need to do is reduce the size of these to something a bit more appropriate for the map scale, and for that we need to discuss rules.
Renderer Rules
As mentioned before, the map is made up of points, lines and areas. Maperitive uses a set of rules to determine how these are shown on the map. For example a rule for residential roads says to draw it in white with a black border and at a specific width. In order to change how the map looks we have to change the rules. Maperitive uses a default set of rules and we need to change these for every map to focus on the things we want to show.
In Maperitive enter the command:
edit-rules
This will open a text editor showing the default rules. Save this file as rules.txt into the folder where you saved nymr.osm. Keep the text editor open.
Next we tell Maperitive to use our newly saved rules file:
use-ruleset location=rules.txt as-alias=myrules
apply-ruleset
The map should look the same, however every time we edit and save the rules file the map will automatically update to show the new version of the map.
Search for the following line:
target : highway private
and below it you will find the rules for showing private “highways”, which includes tracks:
target : highway private
define
line-width : 4
line-style : dash
line-color : #F7D4D4
draw : line
Change the line-width from 4 to 1 and save the file. The thick pink track lines on the map will be replaced with thin lines.
It is important to note that the indentation in the Maperitive rules file is important and must always be used with tabs. For example don’t use spaces as it won’t work.
Customizing the Map
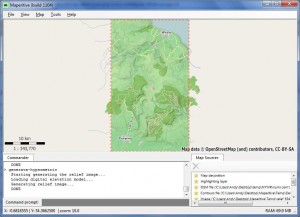
The central area of the map shows the North Yorkshire Moors, which is a hilly region and could be made more interesting. We can do that by adding three additional layers to the map, all of which are available from the Tools menu in Maperitive.
First, add contour lines. These show the height of the land, and are added by going to the Tools menu and choosing Generate Relief Contours.
Next add hillshading. This is a trick to make the map look three dimensional by showing shadows on the south and eastern sides of raised land. To add this go to the Tools menu and choose of the Generate Hillshading items. You can do this multiple times for more emphasis if you want.
The last step is to change the color of the land to indicate the height, which is called hypsometric tinting. Adding this layer makes the map look like it comes from a beautiful atlas. Add it by choosing Generate Hypsometric Tinting from the Tools menu.
If you look at the bottom of the Maperitive window you will see the current zoom level. The zoom level increases as you zoom into the map, with level 18 being the current maximum. In the rules the maximum and minimum zoom levels are often specified. This allows more features to be shown as you zoom into the map and less as you zoom out. Railway lines are one of the items that are not shown when zoomed out, so we need to change that.
Find the entry for
target: railway
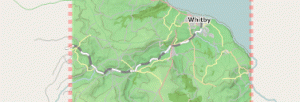
and change the first two min-zoom entries from 13 to 8. Save the file. The map will now show the full-time commercial railway line from Whitby.
Next we need to show the railway stations, which are currently not rendered at all. The rules file starts with:
features
 points, areas
below this are a set of target name descriptions. Add a new entry, making sure to indent it with tabs:
railway station: railway=station
Again find:
target : railway
and just above that line add a new rule, making sure to copy the indentation that is used for similar rules:
target : railway station
 define
 min-zoom : 8
 shape : circle
 shape-size : 10
 line-color : gray
 line-width : 2
 fill-color : red
 fill-opacity : 1
 draw : shape
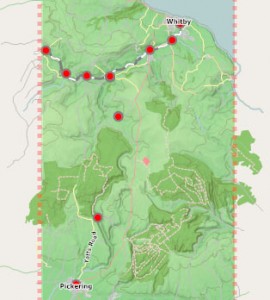
Save the file and the map will now show red circles for the train stations.
Finally we need to add a target description for preserved railways and a rule on how they should be rendered. Below the “lines” heading of the “features” section at the start of the rules file add:
preserved railway: railway=preserved
then above the railway station rule add the rule (again with the correct indentation):
target : preserved railway
 define
 min-zoom : 8
 line-color : black
 line-width : 3
 draw : line
 define
 min-zoom : 8
 line-style : dashlong
 line-color : white
 line-width : 3
 border-style : solid
 border-color : black
 border-width : 25%
 draw : line
Save to render the North Yorkshire Moors Railway line.
Export the Map
To save the map as a bitmap enter the command:
export-bitmap file=nymr.png scale=6
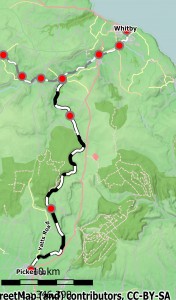
Here is the final map (click to view):
Now you can edit it to add labels, borders, a compass rose, etc.
| Print article | This entry was posted by Andy on January 16, 2011 at 3:21 pm, and is filed under Mapping. Follow any responses to this post through RSS 2.0. Both comments and pings are currently closed. |
Comments are closed.

about 11 years ago
This is a great tutorial, and will be of some help in my project I believe. I’ll have to tinker with things later this evening.