Interesting Tech Projects
Andy
Located in Tucson, Arizona, USA
Homepage: http://www.britishideas.com
Posts by Andy
Accessing an Overloaded C# Constructor from IronPython
May 14th
The C# class ‘Foo’ has four constructors. The glue between IronPython and C# is not choosing the correct one. Here is how to force it.
import clr
typ = clr.GetClrType(Foo)
ctor = typ.GetConstructors()[3]
newfoo = ctor.Invoke(System.Array[object](['string value', 1234]))
newfoo is now an instance of the Foo object, created using a string and int parameters. Here we are assuming the fourth constructor is the one we want, which isn’t very robust. Instead the constructors can be enumerated and the parameters evaluated to determine the correct constructor to use.

868MHz PCB Antenna
Dec 30th
I recently had a need to design an antenna on a PCB for LoRa, an 868MHz long range, low power communications protocol. For this project I decided to use an off-the-shelf LoRa module that already contained an RF matching network. The only requirement was a 50 Ohm antenna that would work at the desired frequency. Space on the board was limited.
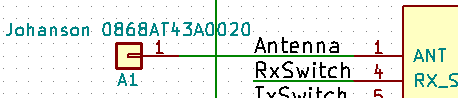
I decided to use a ceramic antenna to save space, selecting the Johanson 0868AT43A0020. The manufacturer has a datasheet showing how the part needs to be placed on a PCB.
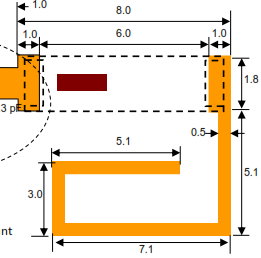
First step was to create a new PCB footprint containing the required layout.
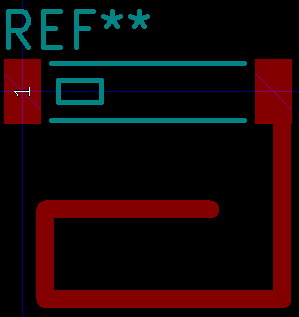
The layout was followed precisely. I used the silkscreen to clearly indicate the orientation of the antenna. Note than only one end of the antenna is given a pin number. The other end is “no connection”. The schematic used a single pin connector component:
When laying out the PCB a “keep out” area was added to both sides of the PCB, making sure it extended 3mm beyond the antenna per the data sheet.
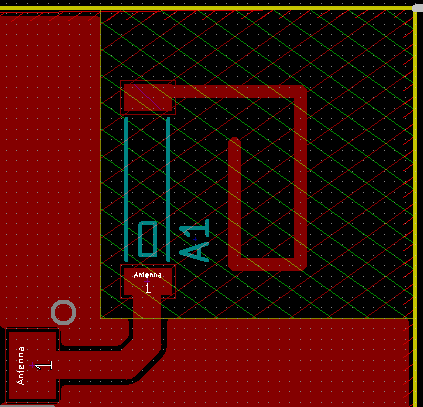
The track from the component pad to the antenna needs to have an impedance of 50 Ohms in order to minimize loss. It also needs to be surrounded by a ground area and have a ground area on the other side of the board. This is called a coplanar wave guide with ground plane.
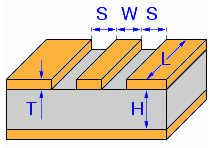
KiCAD has a built in calculator to work out the required track width in order to achieve 50 Ohms impedance. Here are the parameters I used for a standard 1.4mm FR4 two-layer PCB. I played around with the track width until I got close to 50 Ohms.
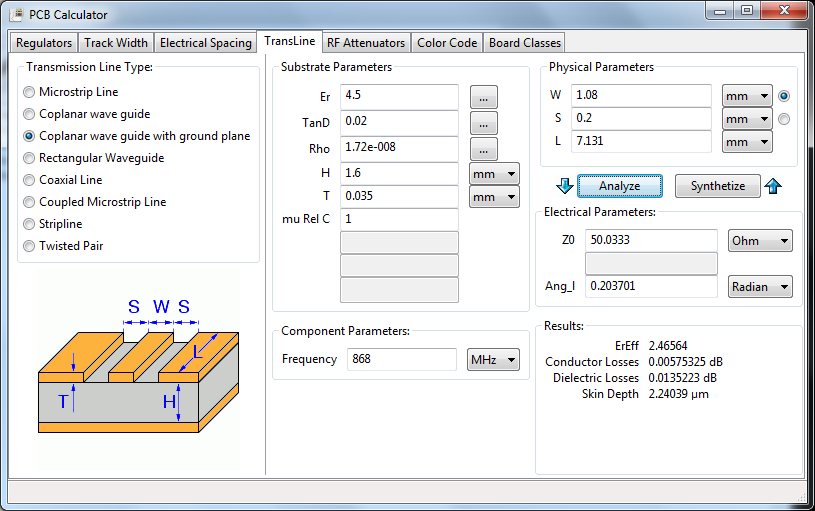
This gave a track width of 1.08mm when the gap between the ground and the track is 0.2mm (the KiCAD default).
- Er = 4.5 (FR4 PCB material)
- TanD = 0.02 (FR4 PCB material)
- Rho = 1.72e-008 (copper tracks)
- H = 1.6mm (standard two layer board thickness)
- T = 0.035mm (1oz copper thickness)
- S = 0.2mm (gap between ground pour and track on the track side of the board)
- L = 9.554mm (length of the track from pad to antenna)
- Frequency = 868MHz

Halogen Reflow Oven Using Off-the-Shelf Parts
Dec 28th
Here is my version of a solder reflow oven for surface mount PCBs. It is a merging of the following two projects, taking advantage of cheap and easy to obtain halogen ovens and off-the-shelf control hardware, avoiding the need to create custom electronics.
- https://apollo.open-resource.org/mission:resources:picoreflow
- http://andybrown.me.uk/2014/05/11/awreflow/
The halogen oven part of the build is identical to Andy Brown’s build. Same oven, same thermocouple, same modifications (remove fat spatter shield, modify fan, install thermocouple).
The software uses picoReflow on a Raspberry Pi Zero W (which has built-in wifi). I have made some improvements to the software which you can obtain from github here: https://github.com/ajayre/picoReflow
- Performs trimmed mean averaging on the temperature values to allow use of noisy thermocouples
- Retries failed MAX6675 connections so it works at power on reset from /etc/rc.local
- Added a temperature compensation offset
- Removed check for sudden temperature increases (allows PID step and bump tests)
- Uses PID with 2Hz PWM taken from Andy Brown’s code
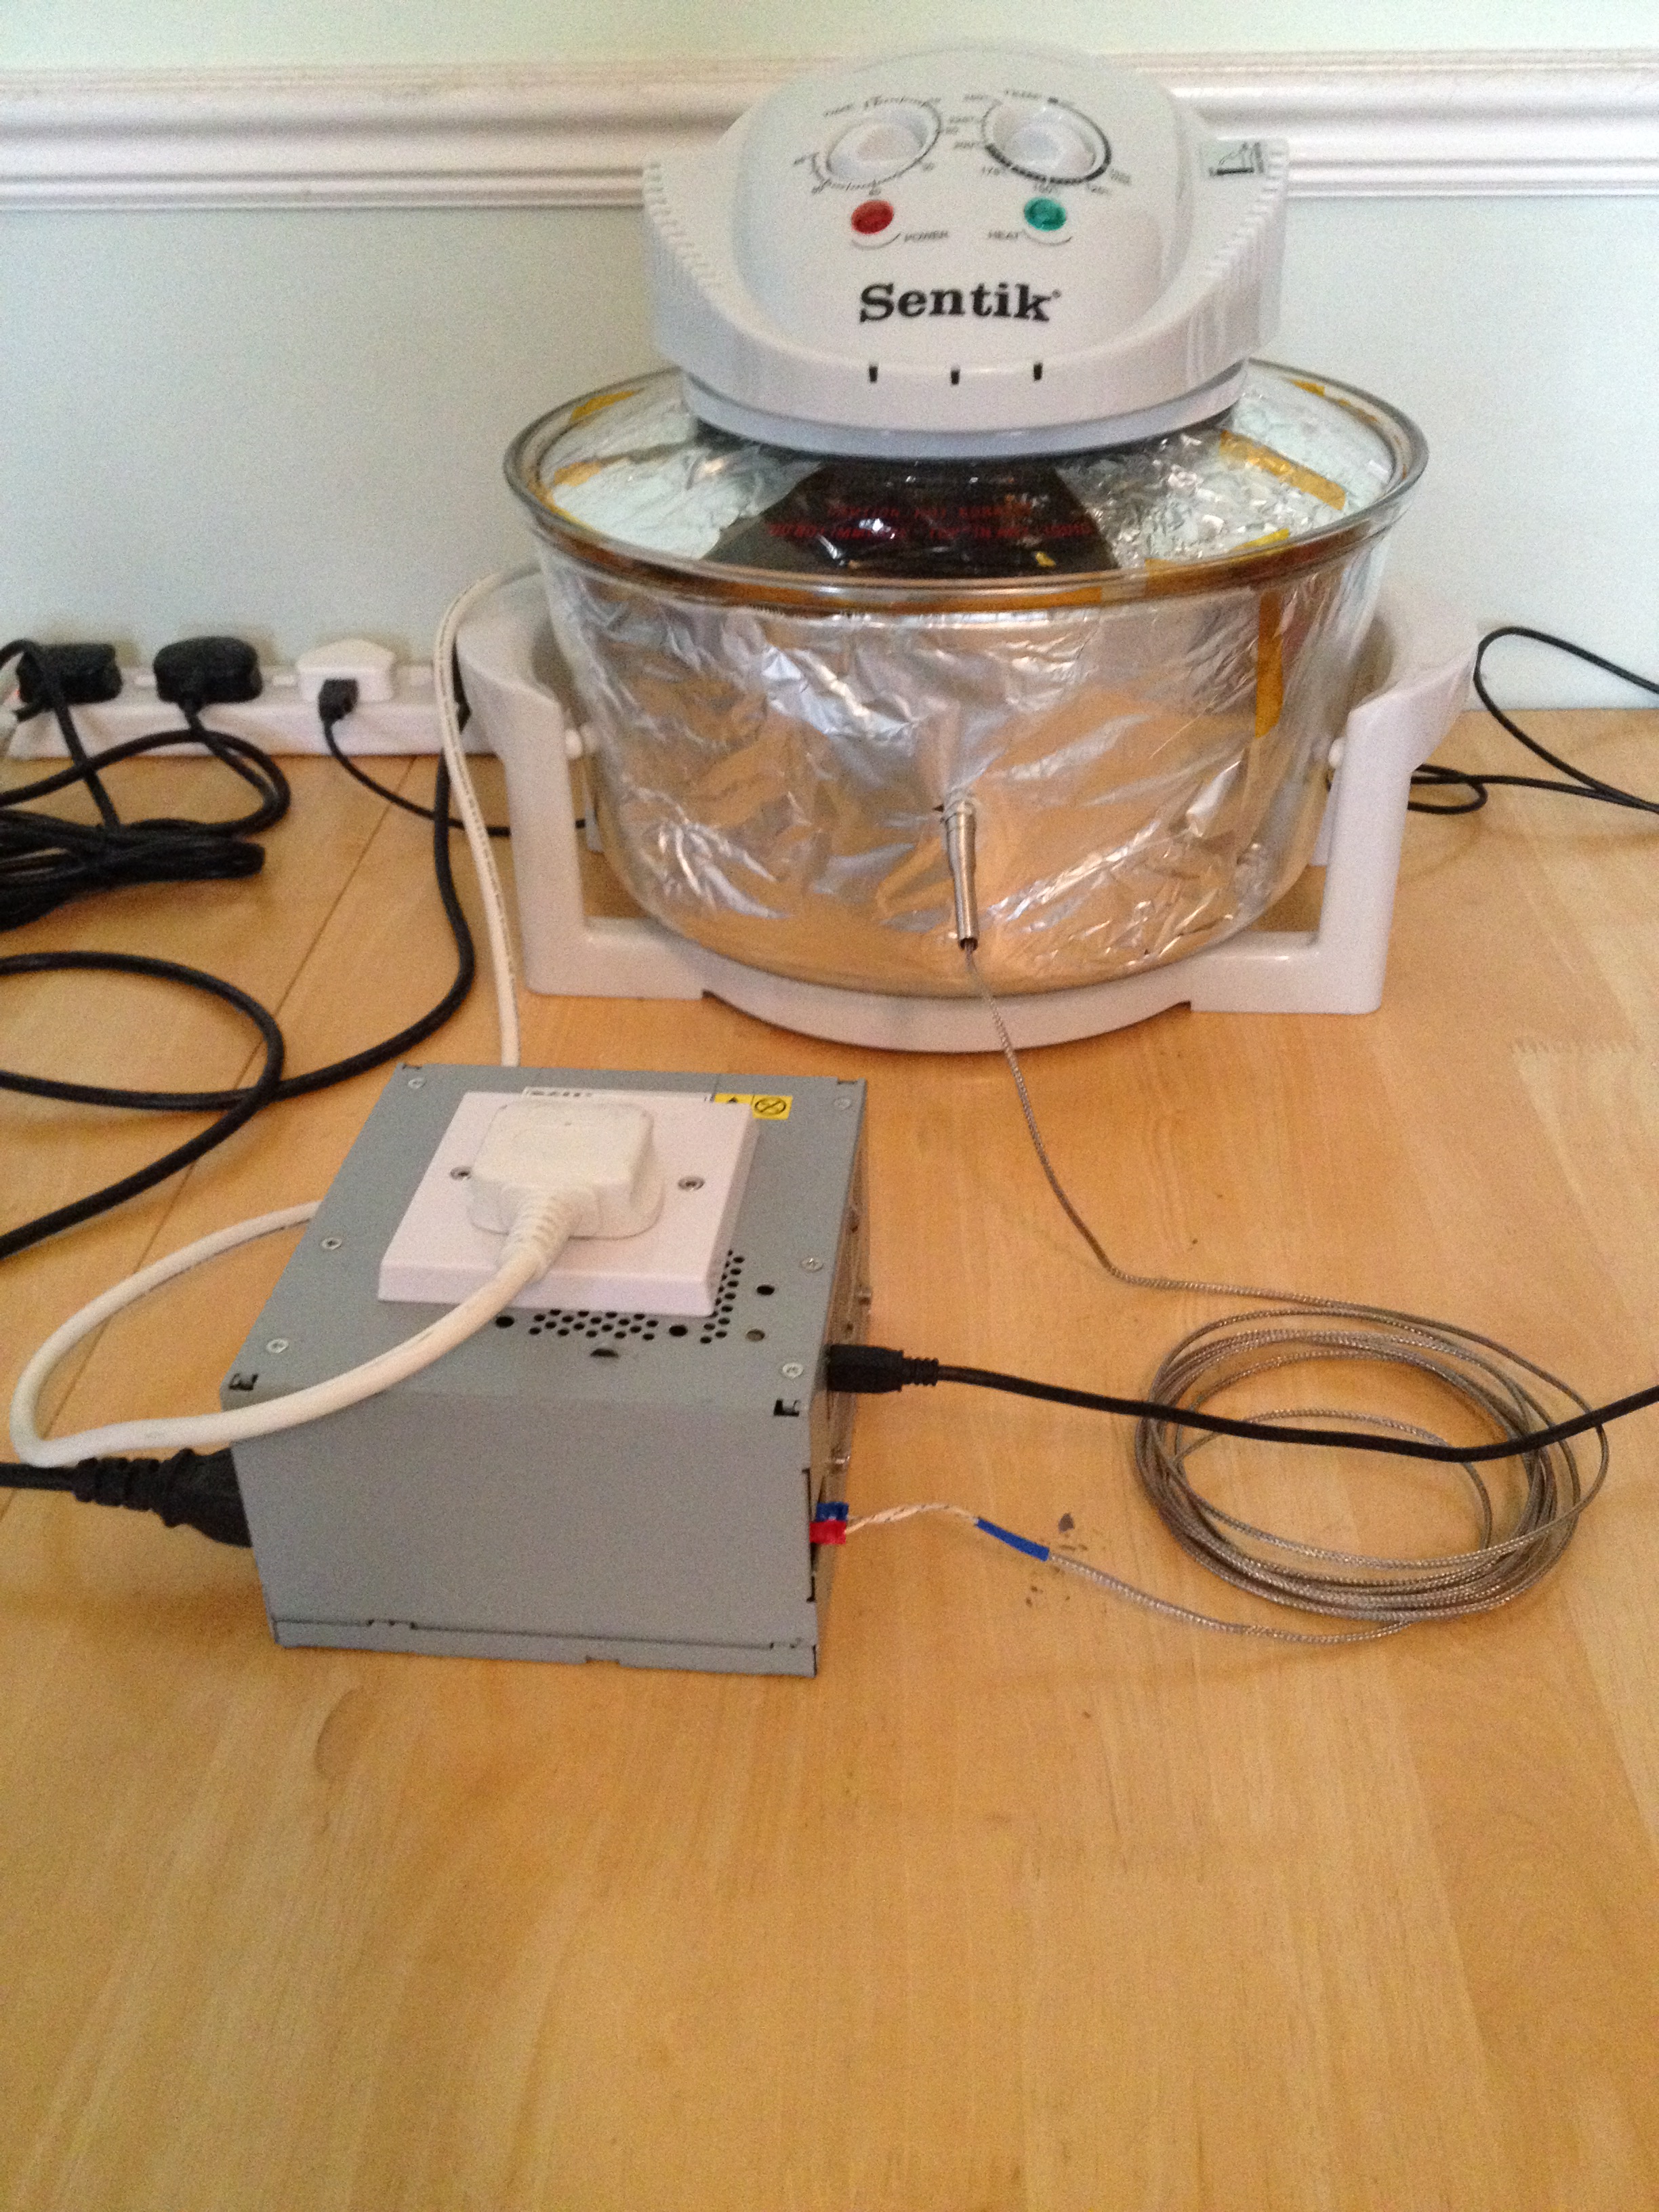
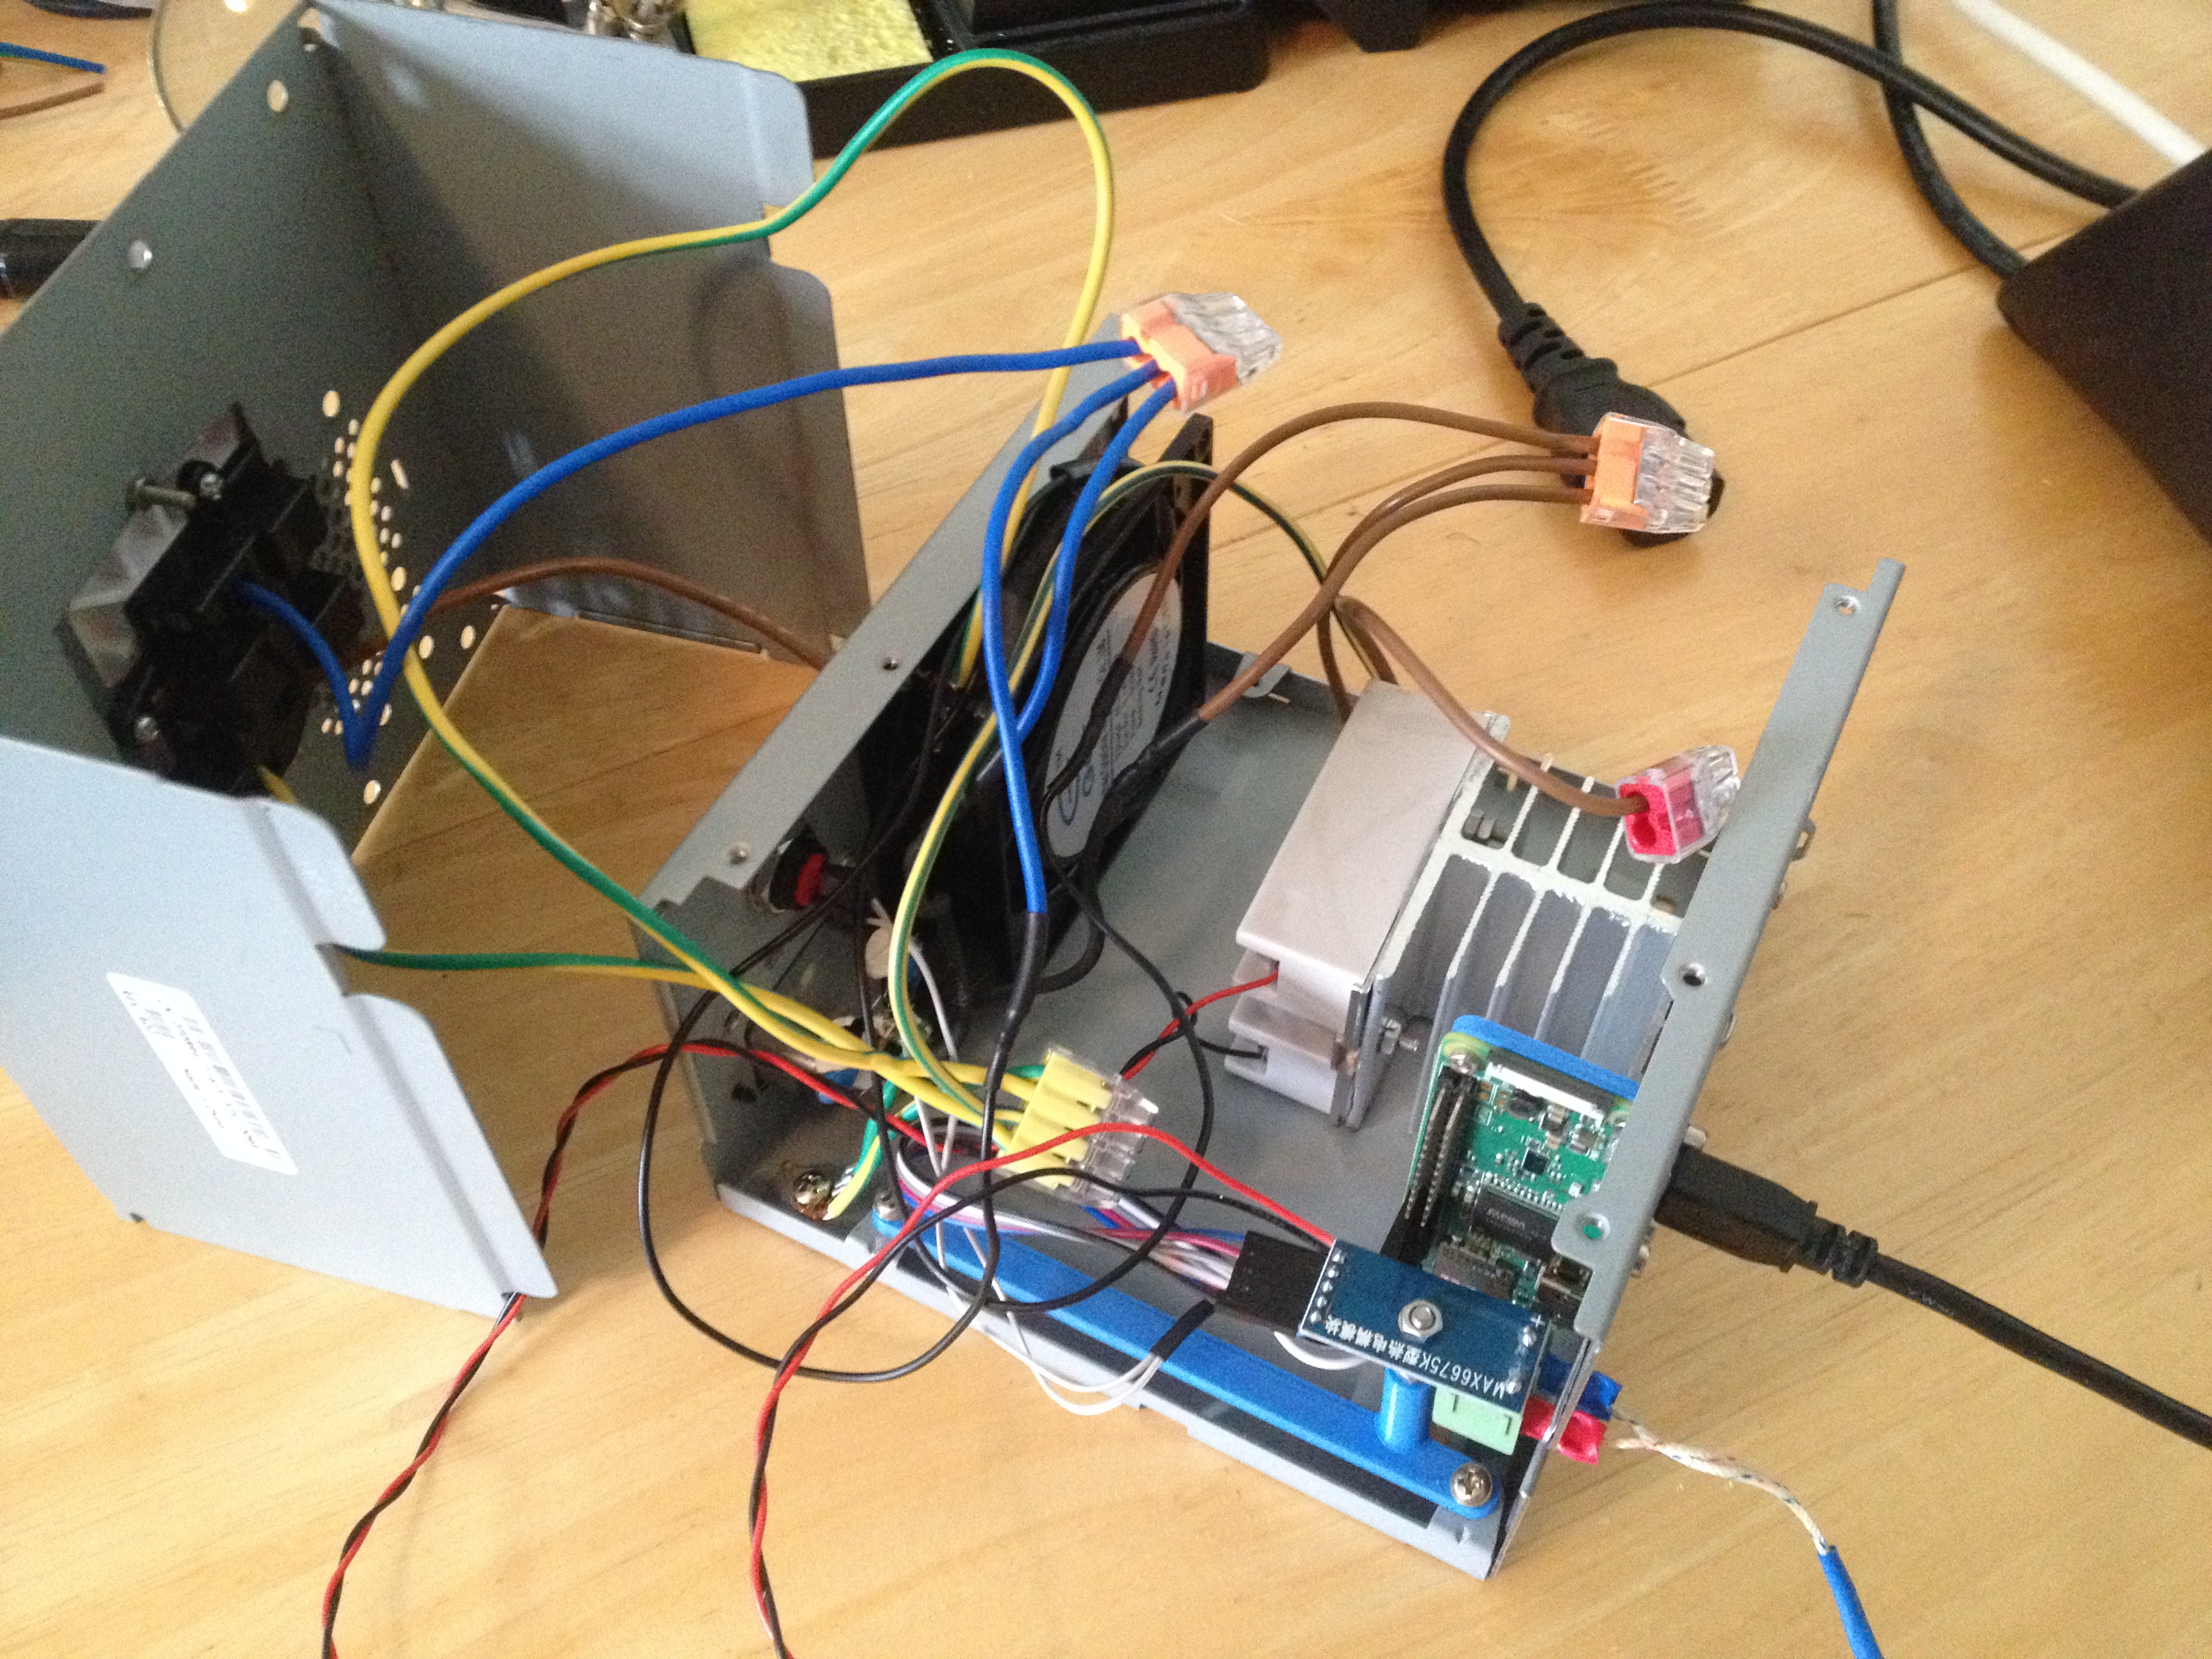
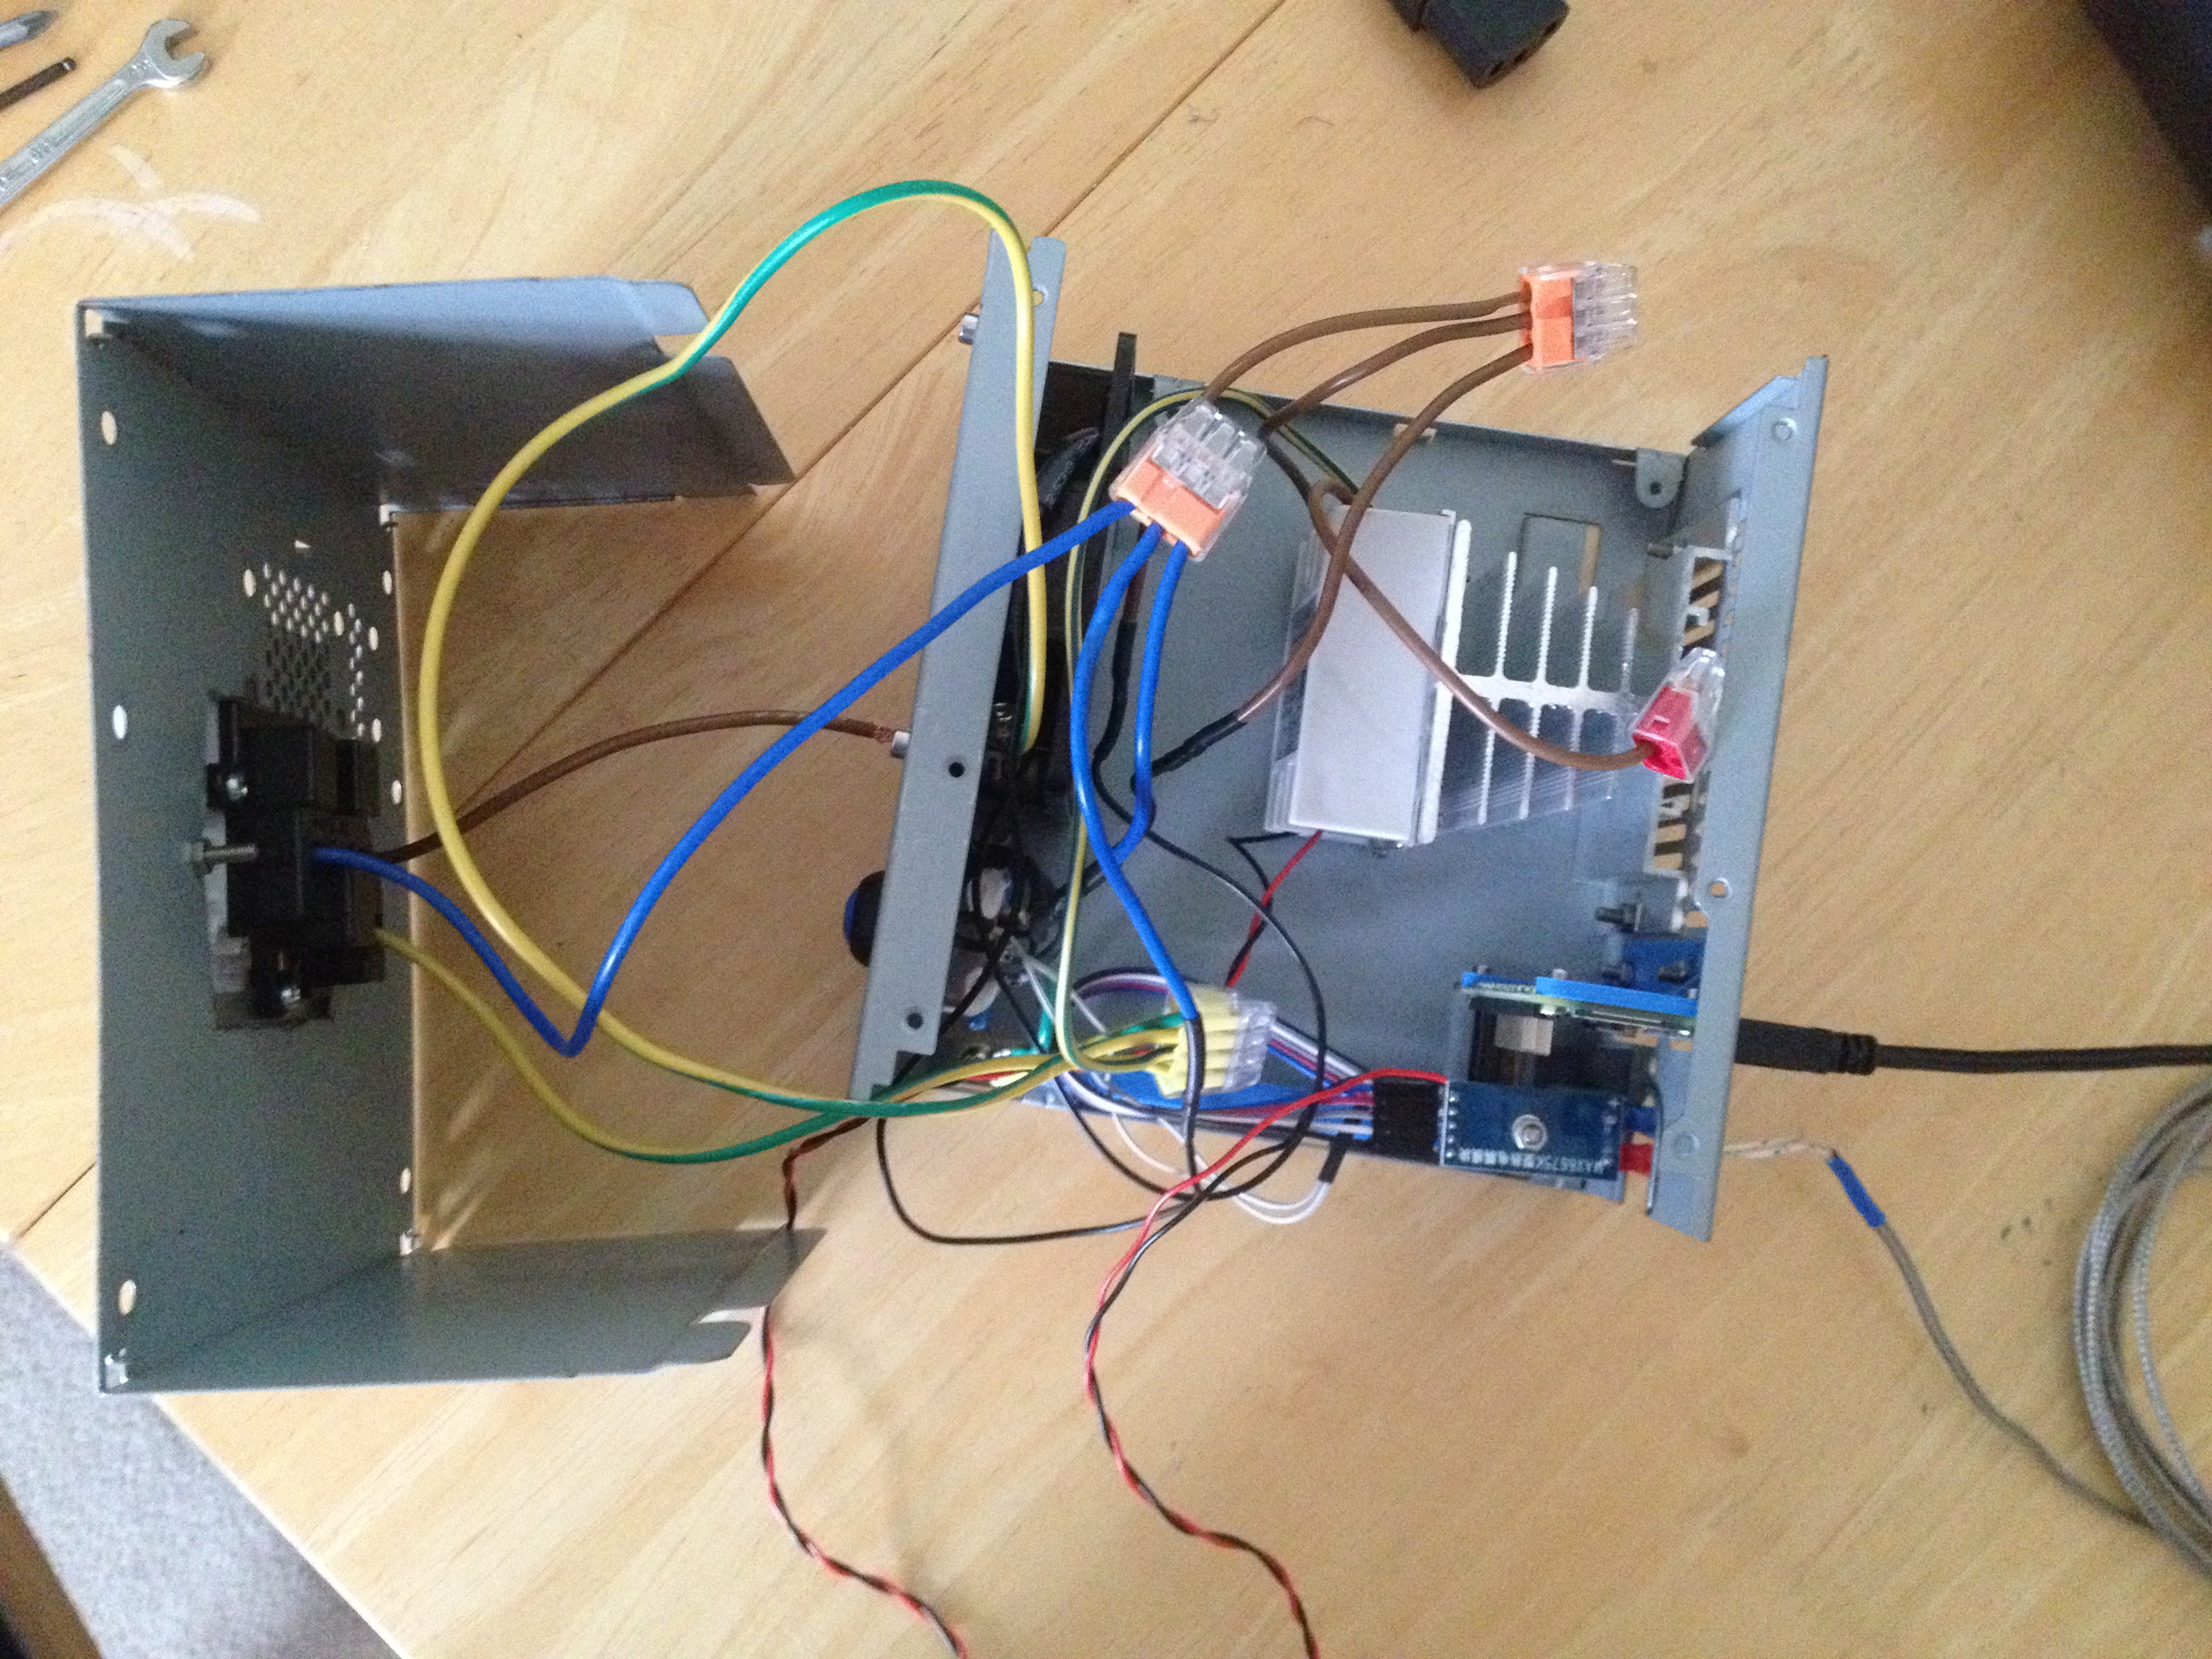
I made some changes to the power/control system. Like Andy Brown I used an old desktop PC PSU case. I removed everything from it except for the power connector. Into the case I put:
- SSR relay and heatsink
- 240V 80mm case fan
- Raspberry Pi Zero W
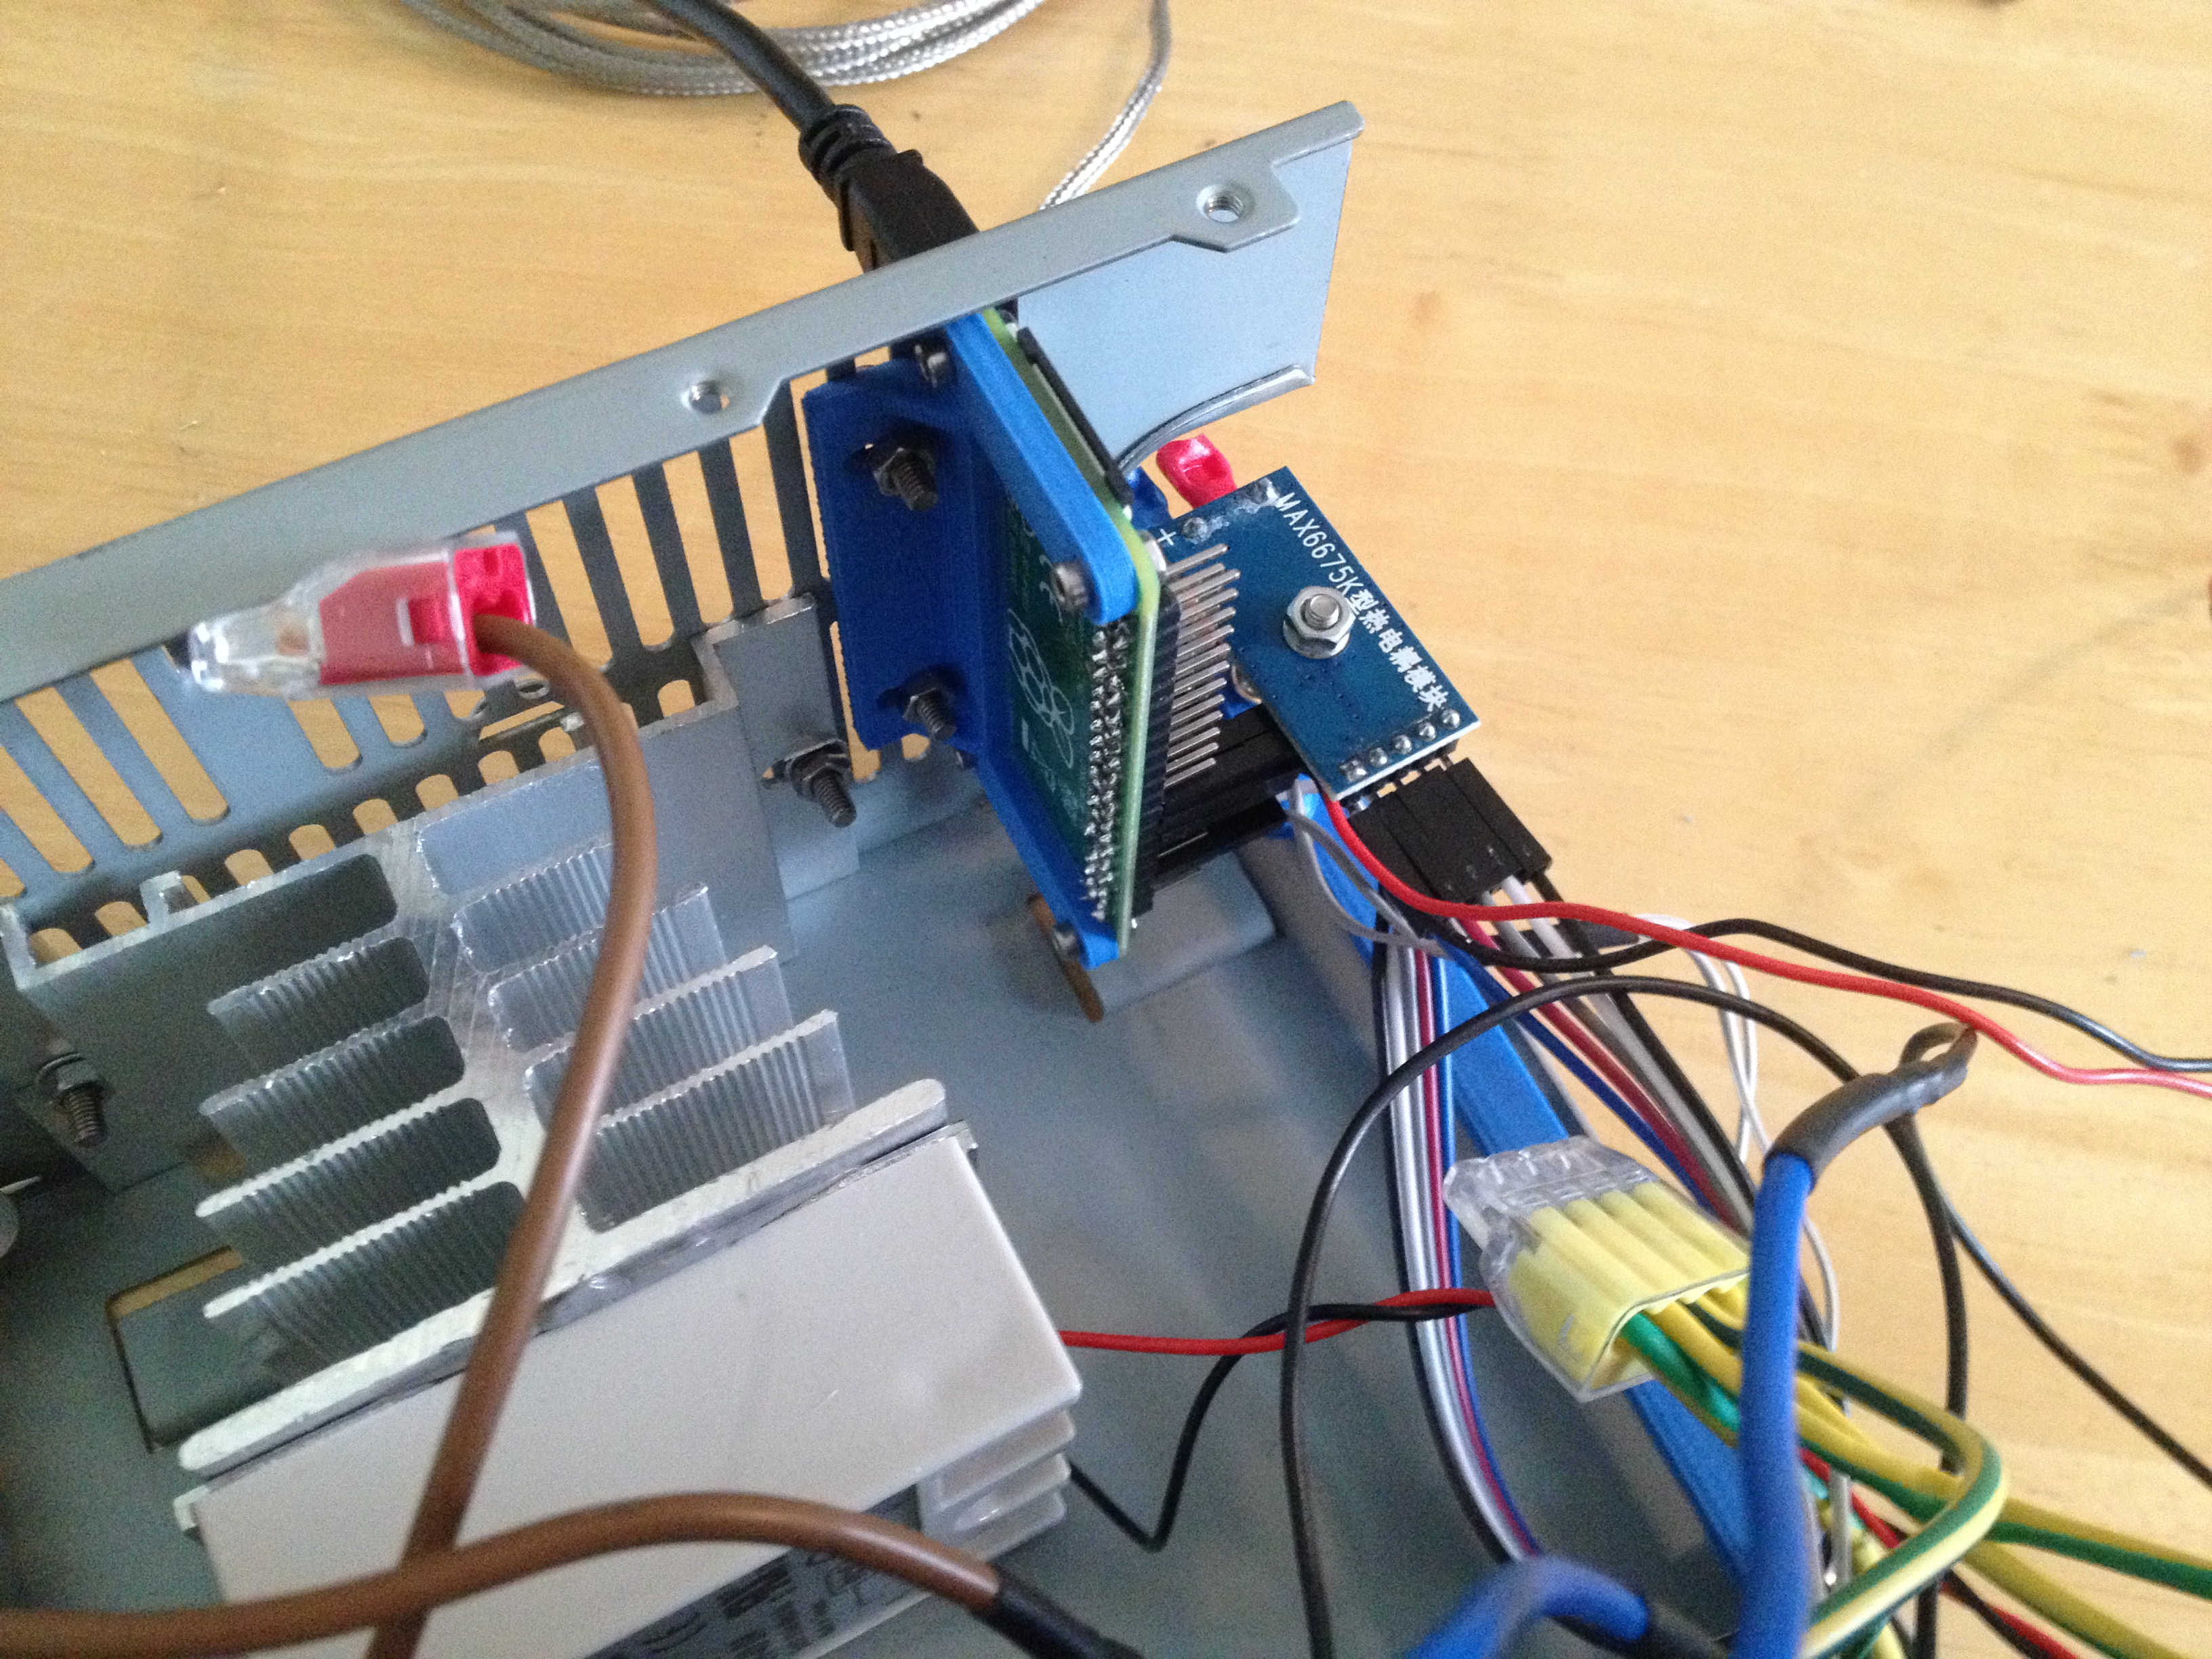
- MAX6675 thermocouple IC
The connections are very simple. The relay and the fan are connected to 240V. The MAX6675 is connected to the Raspberry Pi and the Raspberry Pi controls the relay. The fan is always on when power is applied.
I also added a push button connected to a Raspberry Pi GPIO. When pressed it runs a simple python script that shuts the Raspberry Pi down cleanly.
I 3D printed a couple of brackets to mount the electronics in the case – they are blue in the pictures. In order to connect the Raspberry Pi to a USB cable for power I removed part of the grille.
I am initially testing with lead-based solder, so I copied the reflow profile from here: 

Drum and Banjo Head Tension Gauge
Aug 25th
Measuring the tension on the head of a drum or banjo is important in order to be able to determine if the head is the right tension for your needs. It’s also useful to measure tension that gives a particular tone you like, ensuring you can always get back to the same tension after swapping the head or experimenting.
A commercial gauge is available called a Drum Dial and retails for $60 or more. Here is how I made mine for just a few dollars.
I started off with a cheap Harbor Freight dial indicator. Mine is digital but the analog version would work fine also. These can be picked up for $15 or less with coupons.
Next I added a base. I 3D printed mine but it can also be made out of wood. The spring in the dial indicator is quite weak so I designed the base so that the zero point is one millimeter from maximum spring compression. This ensures that we are using as much spring pressure as the dial indicator can give to press into the head. The base is a friction fit onto the indicator and a tight fit is needed. The bottom of the base has to be completely flat.
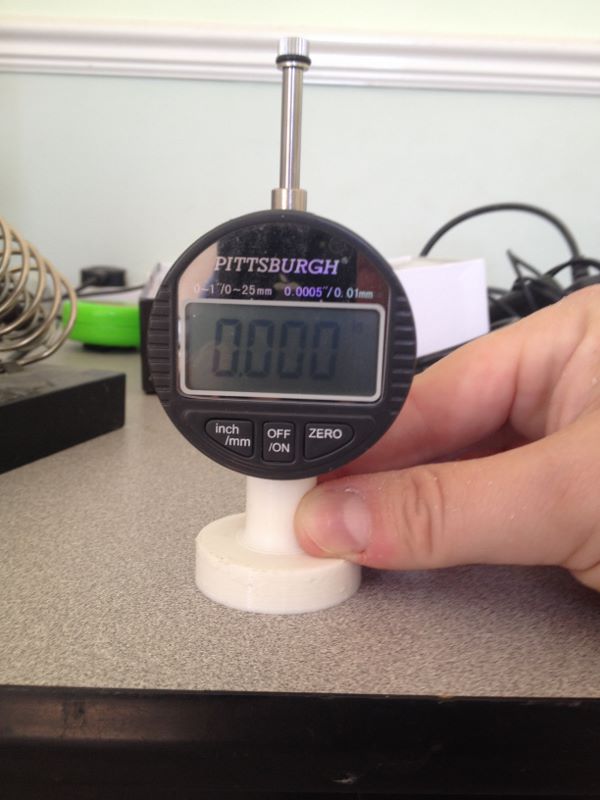
Once the base is installed turn on, press down on a flat surface and set to zero. Remove from the surface and apply a few times to make sure the zero point is always found.
Now press down on the drum or banjo head to measure the head tension. The Drum Dial comes with a spacer to help keep measurements away from the tension hoop. I decided to eyeball it instead.
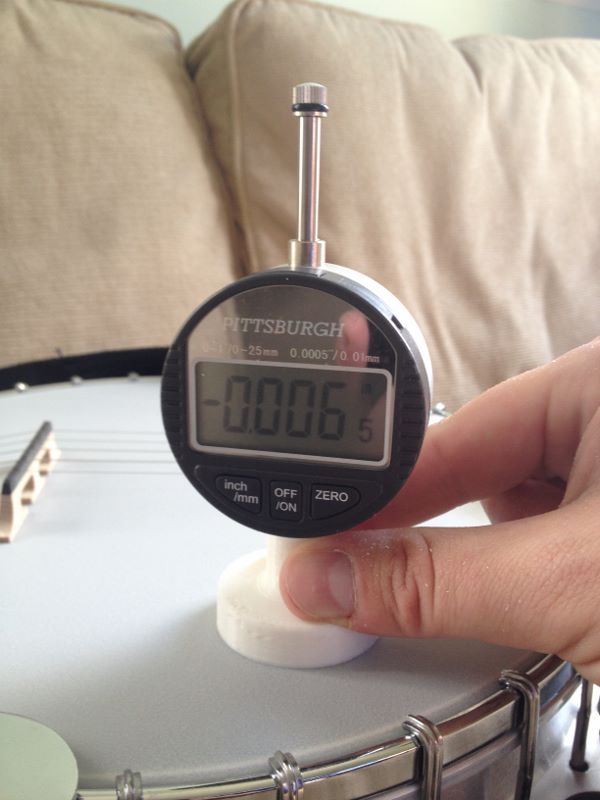
The values obtained can’t be compared with a Drum Dial or other DIY tension gauges because the result is dependent on the strength of the spring however Drum Dials use a scale that sets 100 to the highest tension. To convert the dial indicator value to the same scale:
- 0.000″ = 100
- -0.001″= 99
- -0.002″ = 98
- …
- -0.010″ = 90
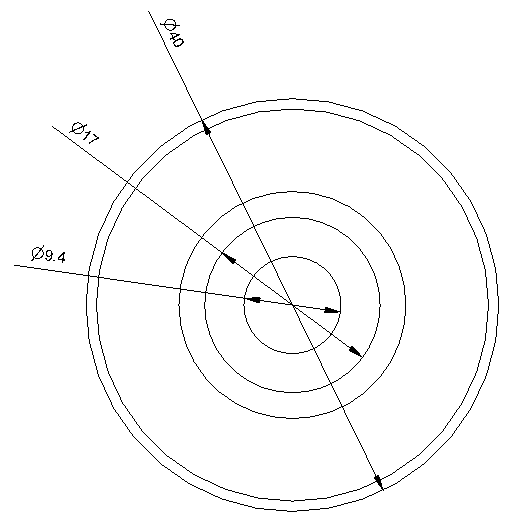
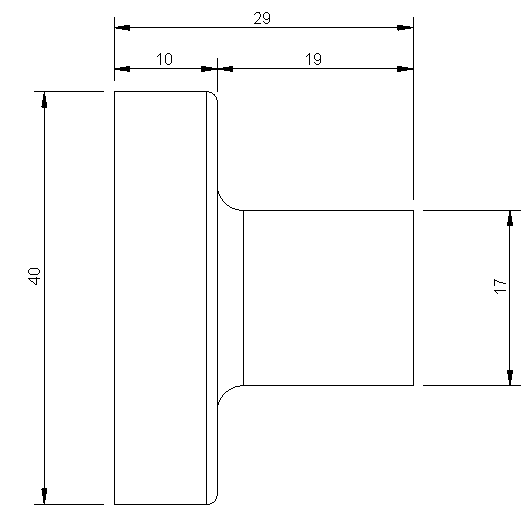
The 3D printed base used three shells, 20% infill, took about one hour and cost about $0.40 in plastic.
Here are the dimensions of the base for making your own. All dimensions are in millimeters.

PCB For Raspberry Pi WH1080 Weather Station
Nov 15th
Previously I wrote about using a Raspberry Pi to receive 433MHz signals from a WH1080 weather station. This is the mess of wiring I came up with:
")
This worked fine until it stopped. I probably didn’t crimp a wire properly and too many knocks resulted in unreliable operation. To solve this I designed a PCB that connects the radio receiver, pressure sensor and an antenna to a Raspberry Pi:

The design is very simple:

It accepts a surface-mount version of the RMF01 module (the version with a black resin blob). This is easily soldered onto the PCB by hand.
A female through-hole SMA connector is used for the antenna connection. This allows a range of off-the-shelf antennas to be used. The one I purchased from eBay didn’t work so I modified it as can be seen in the pictures. Alternatively a wire can be directly soldered to the board.
Finally a six pin BMP085 module is connected to a header. The pinout of the BMP085 module used is:
- Pin 1 = 3.3V
- Pin 2 = SDA
- Pin 3 = SCL
- Pin 4 = No connection
- Pin 5 = No connection
- Pin 6 = Ground
Here is how the PCB looks when populated:

Download the schematic diagram (15MB).
I have some spare boards, so if you would like one to experiment with please contact me.
Update: All the spare boards are gone. I hope everyone who received one has a lot of fun with them!
Here are the gerber files, suitable for submitting to a PCB house. The license is CC-BY-NC SA. I.e. for personal non-commercial use only. Sorry, but I am unable to provide support for these files.

Tenting Vias in DesignSpark PCB
Oct 10th
Sometimes it is useful to cover vias with solder mask. Here is how to do it in DesignSpark PCB. First the solder mask with the vias exposed:

1. Choose Design Technology… from the Settings menu

2. Click on the Solder Mask row and then the Edit… button

3. Uncheck the Vias setting and click on OK.
4. Click on OK to close the dialog window.
At this point the solder mask should automatically update to show the vias are now covered. If it doesn’t deselect the layer and reselect it to force a refresh.


Generating a Part Library in Geomagic Design
Jul 5th
Introduction
This tutorial demonstrates how to create a library of parts in a CAD neutral format based on a single template part. It takes advantage of parameterization in Geomagic Design.
We will start by creating the base part that we will use to create the library. This will be a simple cap head bolt.
Next we will use WizoScript to generate a library of 10 bolts of different lengths.
This type of task is ideally suited to scripting because it handles the tedious repetitive operations needed. While the part demonstrated in this tutorial is simple the same principles can easily be used for complex parts with multiple parameters.
Creating the Template Part
In Geomagic Design create a new part and then a sketch on the XY-Plane. On this sketch draw a circle centered on the origin with a diameter of 4mm and then extrude into a cylinder with a length of 10mm.

Under the Viewing and Analysis tab click on the Equation Editor button.

Double-click on “D2” and enter “Length” to give the length of the bolt a useful name then close the equation editor window.

Create the bolt head by adding a sketch to the end of the cylinder on the XY-Plane, setting the diameter to 8mm and extruding 4mm.

Create a new sketch on the top of the bolt head, draw a hexagon with an inside diameter of 4mm and then extrude cut 2mm.

Create a new folder called “PartLibrary” and save as TemplatePart.AD_PRT. Keep the part open in Geomagic to continue with the tutorial.
Writing a Basic Script
Start WizoScript 1.70 or later. When it runs it automatically creates an empty script that we can start using right away.

First we need to tell the script about our template part. For this tutorial the part must be open in Geomagic when the script runs, however it is possible to use a saved part that is not currently open. Please see the WizoScript reference manual for further details.
The following script line tells WizoScript “I have a part open and I want you to use it”:
TemplatePart = Part(“TemplatePart”, False)
Next we need to get access to the length parameter that we have already created it. Once we have access to it we can change its value
Length = TemplatePart.GetParameter("Length")
The default units for a script are millimeters, so if we enter the following:
Length.Value = 10
Then we are setting the length of the bolt to 10mm. Enter this into the script.
Now that we have set the length of the bolt we need to export it in a CAD-neutral formal so it can be shared with others. Here is how to do it:
TemplatePart.ExportSTEP214("C:\Users\Andy\Desktop\M4-Bolt-10")
This is what you should have so far:

Save the script and click on the Run button. If there are any errors correct them in the script and try again. If the script is successful you should now have a M4-Bolt-10.stp file.
Generating Multiple Parts
So far it’s not very interesting. We’ve generated a single STEP part that we could have easily created directly in Geomagic Design without needing scripting. Now we will look at generating multiple parts in one go.
The first step is to create a function that is given a length and creates a STEP file. A function is a way of grouping parts of a script together so they can be run over and over again. Edit your script to look like the following:
def GenerateBolt(NewLength):
  Length.Value = NewLength
  TemplatePart.ExportSTEP214("C:\Users\Andy\Desktop\M4-Bolt-"+str(NewLength))

TemplatePart = Part("TemplatePart", False)

Length = TemplatePart.GetParameter("Length")

GenerateBolt(10)
GenerateBolt(12)
We now have a function called GenerateBolt that takes a length and creates a STEP file. The function has to be defined before it is used so put it at the start of the script.
Another key change is that the name of the STEP file contains the length, whatever that may be. This is achieved by appending “M4-Bolt-“ with the length value.
Run the script. It will call GenerateBolt twice and create two STEP files containing a 10mm bolt and a 12mm bolt.
The final step is to create a loop that goes from a minimum length to a maximum length creating bolts. Replace the two calls to GenerateBolt with the following:
MinimumLength = 10
MaximumLength = 20
for NewLength in range(MinimumLength, MaximumLength + 1):
  GenerateBolt(NewLength)
Run the script and it will generate bolts with lengths from 10mm to 20mm.
Here is the final script with comments added to explain:
# Takes a template bolt and creates a library of bolts of different lengths in
# a CAD neutral format

# Creates a bolt of a specific length. NewLength = desired length of bolt in mm
# Saves the bolt to the desktop as a STEP file
def GenerateBolt(NewLength):
  Length.Value = NewLength
  TemplatePart.ExportSTEP214("C:\Users\Andy\Desktop\M4-Bolt-" + str(NewLength))

# Get access to currently opened part that we will used as a template
TemplatePart = Part("TemplatePart", False)

# The template part has a Length parameter defined which we will control
Length = TemplatePart.GetParameter("Length")

# Create bolts from 10mm to 20mm
MinimumLength = 10
MaximumLength = 20
for NewLength in range(MinimumLength, MaximumLength + 1):
  GenerateBolt(NewLength)

Cooke Triplet Lens System in Geomagic Design
Jul 3rd
The Cooke Triplet is a system of three lenses designed in the 19th century to reduce distortion. In 1950 a specific triplet was invented and patented by Eastman Kodak (EF=100mm, f/1.9) and we will look at how to recreate it in Geomagic Design using scripting. We will create a script that can generate any type of thick lens, including how to solve the lensmaker’s equation. Hopefully the techniques demonstrated here will be useful to others solving and creating mathematical shapes in Geomagic Design.

Download, install and run WizoScript 1.70 or later. Start Geomagic Design. This script was tested with version 16.0.1.16490.
First we must enable a couple of useful libraries and make sure our script is using millimeters to match the values in the patent.
import sympy
from sympy import *
import math

Units.Current = UnitTypes.Millimeters
We are going to generate three lens parts and save them so we need to specify a location to save to. Change this to make your PC.
OutputFolder = "P:\\temp"
The patent completely describes the three lenses but we are going to make it a bit more interesting by calculating the radius of the back of the lens from the focal length. To do that we need to use the lensmaker’s equation.

In the formula the radius of the back of the lens is R2. This appears in two locations in the formula. We could rearrange it to give us R2 = … but that is a bit tedious. Instead we can leave WizoScript to worry about it instead. Here is how we enter the equation into the script using ‘rb’ to represent the radius of the back of the lens.
# calculates the back radius of a lens based on the other parameters
# uses the lensmaker's equation
def GetBackRadius(FrontRadius, Thickness, RefractiveIndex, FocalLength):
  rb = Symbol('rb')
  Equation = Eq((RefractiveIndex-1)*((1/FrontRadius)-(1/rb)+(((RefractiveIndex-1)*Thickness)/(RefractiveIndex*FrontRadius*rb))),(1/FocalLength))
  # we don't bother rearranging the equation, instead we let the sympy module do that for us
  BackRadius = solve(Equation)[0]
  return BackRadius
WizoScript rearranges the equation and calculates the value we need using the single line:
BackRadius = solve(Equation)[0]
The equation is placed into a function called ‘GetBackRadius’ which calculates the value when given a set of parameters, such as the thickness of the lens, refractive index of the material, etc. We can call the function repeatedly for different parameters.
Now we need to start creating a part for a single lens. First we tell Geomagic Design to create a part. We are going to do that in a new function.
# creates a part representing a lens based on a set of parameters
def GenerateLens(Name, Folder, FrontRadius, Thickness, RefractiveIndex, FocalLength, Diameter):
  # get missing parameter
  BackRadius = GetBackRadius(FrontRadius, Thickness, RefractiveIndex, FocalLength)

  # check diameter is small enough
  if Diameter > abs(FrontRadius):
    print "%s diameter is larger than the front radius %f" % (Name, FrontRadius)
    return
  if Diameter > abs(BackRadius):
    print "%s diameter is larger than the back radius %f" % (Name, BackRadius)
    return

  # create new part
  Lens = Part(Name)
The general approach we will take is to draw a 2D profile of half of the lens on the XY plane and then create a revolve boss around the X axis. The X axis is the optical axis (i.e. the center of rotation for the lens).

  # start creating the 2d sketch representing the shape of the lens
  Profile = Lens.AddSketch("Profile", Lens.GetPlane("XY-Plane"))

  LensRadius = Diameter / 2.0
First we will draw the front of the lens. There are three possibilities, the front is flat (infinite radius), bulging out aka convex (positive radius) or indented aka concave (negative radius). We treat each case individually. Simple trigonometry is used to calculate the end points of the front. Note that infinity is represented in the script by ‘oo’.
  # draw shape of the front of the lens, it can be flat, convex or concave
  if FrontRadius == oo:
    FEndX = 0
    Profile.AddLine(0, 0, FEndX, LensRadius, False)
  elif FrontRadius > 0:
    Angle = asin(LensRadius / FrontRadius)
    FEndX = FrontRadius - (cos(Angle) * FrontRadius)
    Profile.AddArcCenterStartEnd(FrontRadius, 0, FEndX, LensRadius, 0, 0, False)
  else:
    FrontRadius = -FrontRadius
    Angle = asin(LensRadius / FrontRadius)
    FEndX = (cos(Angle) * FrontRadius) - FrontRadius
    Profile.AddArcCenterStartEnd(-FrontRadius, 0, 0, 0, FEndX, LensRadius, False)
The back of the lens is treated in the same way except the sign of the radius is reversed. This means that a convex shape is a negative radius and a concave shape is a positive radius.
  # draw shape of the back of the lens, it can be flat, convex or concave
  if BackRadius == oo:
    BEndX = Thickness
    Profile.AddLine(Thickness, 0, BEndX, LensRadius, False)
  elif BackRadius < 0:
    BackRadius = -BackRadius
    Angle = asin(LensRadius / BackRadius)
    BEndX = (cos(Angle) * BackRadius) - BackRadius + Thickness
    Profile.AddArcCenterStartEnd(Thickness - BackRadius, 0, Thickness, 0, BEndX, LensRadius, False)
  else:
    Angle = asin(LensRadius / BackRadius)
    BEndX = -(cos(Angle) * BackRadius) + BackRadius + Thickness
    Profile.AddArcCenterStartEnd(Thickness + BackRadius, 0, BEndX, LensRadius, Thickness, 0, False)
Before we can add the revolve boss we must make sure the sketch is closed by drawing the line for the outside of the lens and the line along the optical axis
  # check diameter of lens again
  if FEndX > BEndX:
    print "%s diameter is too large" % Name
    return

  # if this is not a "thin" lens then draw top of profile
  if FEndX != BEndX:
    Profile.AddLine(FEndX, LensRadius, BEndX, LensRadius, False)

  # draw line of profile along x axis (optical axis)
  Profile.AddLine(0, 0, Thickness, 0, False)
Now for the revolve boss.
  # create lens by revolving sketch around x axis
  Lens.AddRevolveBoss("Lens", Profile, Lens.GetAxis("X-Axis"), 360.0)
Creating two reference planes for the front and back of the lens will help with aligning them to create the triplet. Finally we save and close the part.
  # add reference planes to aid in aligning this lens with others
  Lens.AddPlane("Front", Lens.GetPlane("YZ-Plane"), 0);
  Lens.AddPlane("Back", Lens.GetPlane("YZ-Plane"), Thickness);

  # save and close
  Lens.Save(Folder)
  Lens.Close()
The last step is to generate the three lenses needed for the triplet using the values from the patent along with the focal length.
# lens 1
GenerateLens("Lens1", OutputFolder, 62.63, 25.56, 1.745, 73.2, 40.0)
# lens 2
GenerateLens("Lens2", OutputFolder, -66.47, 4.51, 1.647, -37.74, 36.0)
# lens 3
GenerateLens("Lens3", OutputFolder, 119.5, 19.92, 1.697, 54.88, 30.0)
The complete script can be obtained from the script library. Running it will generate three part files, one for each lens.
Create a new assembly and add the three lenses in the order lens1, lens2 and lens3. Align the X axis of all three lenses. Align the front plane of lens2 7.89mm from the back plane of lens1. Align the front plane of lens3 14.14mm from the back plane of lens2.

")

Interactive Mobius Strip Generator for Geomagic Design
Jun 29th
This mini tutorial shows how to generate custom Mobius strips with minimum effort. It demonstrates that python scripting can be used to ask the user for information and then apply it to a part the user is already working on. Hopefully that will be useful to some people when solving problems.
1. Download and install WizoScript 1.70 or later and start it.
2. Start Geomagic Design V16 hotfix 1 (16.0.1.16490) or later.
3. Create a new part and set the units to millimeters.
4. Create a new sketch on the XY plane.
5. Draw a triangle centered on the X axis and set the size of the reference circle to 10mm.
6. Set the center of the triangle 30mm from the origin and exit sketch editing mode.

7. Go to the WizoScript script library and copy the Interactive Mobius Strip Generator. Paste it into WizoScript. Hint: double-clicking on the script in the web-page selects the entire script.
8. Run the script.
9. You will be asked for the name of the part. Assuming you haven’t saved it enter “New Part (1)”. Then you will be asked for the name of the sketch. Enter “Sketch<1>”.
10. Next you will be asked the rotation point along the X axis. Enter “30”. This puts the rotation point at the center of the triangle.
11. You will be asked for the number of rotations. This is the number of times the mobius strip will completely rotate. Enter “3”.
12. Finally you will be asked to enter the number of steps. Enter “30”.

Now the mobius strip will be generated. Be patient as this can take several minutes. Here is what you should have:

Now it’s time to experiment! You can change the shape of the sketch to create different effects. Setting the rotation point closer or further away from the origin will create a “corkscrew” effect. You can increase or decrease the number of rotations. Reducing the number of steps will make the part faster to create but you might have to manually add a guide curve to get a true mobius strip.
Using this script it is possible to run it multiple times on the same part. For example create two sketches, run it on the first sketch and then run it on the second sketch to create two Mobius strips that are intertwined.

WH1080 Weather Station Wind Vane
Jun 10th
I think the jury is still out on the wind vane that comes with WH1080 weather stations (e.g. Fine Offset, Mapin). Some people claim it works fine when placed high up away from any buildings, trees or other obstructions. Many people complain that it is just not reliable regardless. It doesn’t help that the weather stations come with a short pole.
From watching the vane it seems one of the issues is when the wind is gusty. I’ve noticed that when a gust ends the vane becomes destabilized and simply spins around and around.
For me it is simply not feasible to locate the vane on the chimney so I wondered if adding software filtering to my weather station code might work.
pywws already contains wind direction averaging for hourly summaries so I thought it would give that a try. Here is how the wind direction data looked a few days ago before adding averaging to the code:
 The top part shows the wind speed and gusts. The bottom shows the wind direction. As you can see it is hard to see any pattern beyond the wind coming from the south, east or north.
Here is the wind direction data today after adding the averaging:

Much better. It is clear the wind was coming out of the west. While the above data was being captured I could see the vane swinging from north to south all the time, so it is pretty nice that the averaging was able to pick out the correct wind direction.
As previously mentioned the algorithm was taken from pywws, but with a couple of changes added. It works as follows:
- When the receiver starts it collects a new wind vector every 48 seconds. The vector consists of the wind direction and average speed. This comes directly from the weather station transmitter.
- While the receiver is collecting the first 16 wind vectors it reports the current wind direction to Weather Underground. So for the first 12.8 minutes (16 x 48 seconds) after reset the wind direction is not averaged.
- Once 16 wind vectors have been collected the receiver starts averaging the wind direction and reporting the average to Weather Underground. Every 48 seconds when new data is received the oldest wind vector is overwritten. So the receiver always has the last 16 wind vectors to work with.
- The latest 16 wind vectors are converted into weighted vectors. There is one vector for each compass point direction and the size of each vector is the sum of the average wind speeds measured coming from that direction. This method ensures the result favors directions where stronger winds came from.
- Using some trigonometry the average wind direction is calculated.
- In the situation where there is no wind for all 16 wind vectors (so no wind for 12.8 minutes) then the last average wind direction is used.
The code can be obtained from github.